
As the northern hemisphere grapples with a series of intensifying heatwaves, the question of when the summer will reach its absolute thermal peak has become a matter of both public health and logistical planning. While the summer solstice in late June marks the point of maximum solar radiation—the day when the sun is highest in the sky and providing the most direct energy—it rarely coincides with the calendar’s highest temperatures. Instead, a phenomenon known as seasonal lag dictates that the most sweltering conditions typically arrive weeks, or even months, later. By analyzing thirty years of meteorological data provided by the National Oceanic and Atmospheric Administration (NOAA), researchers and climatologists have identified distinct patterns that reveal when different regions of the United States can expect their most grueling days of the year.
The Mechanics of Seasonal Lag and Thermal Inertia
To understand why the hottest day of the year does not occur on the longest day of the year, one must look at the physics of "thermal inertia." The Earth’s surface, composed of vast oceans and diverse landmasses, does not heat up instantaneously. Much like a pot of water placed on a high flame, there is a delay between the application of maximum heat and the point at which the substance reaches its peak temperature.
During the weeks following the summer solstice, the Northern Hemisphere continues to receive more energy from the sun than it loses to space. This net gain in energy causes temperatures to continue rising throughout July and August. The specific timing of the peak depends heavily on local geography, proximity to large bodies of water, and prevailing wind patterns. While the "climatological peak" for the contiguous United States generally falls between July 15 and July 31, regional variations create a complex map of summer intensity that stretches from mid-June to early October.
Regional Variations: A Geographical Timeline of Heat
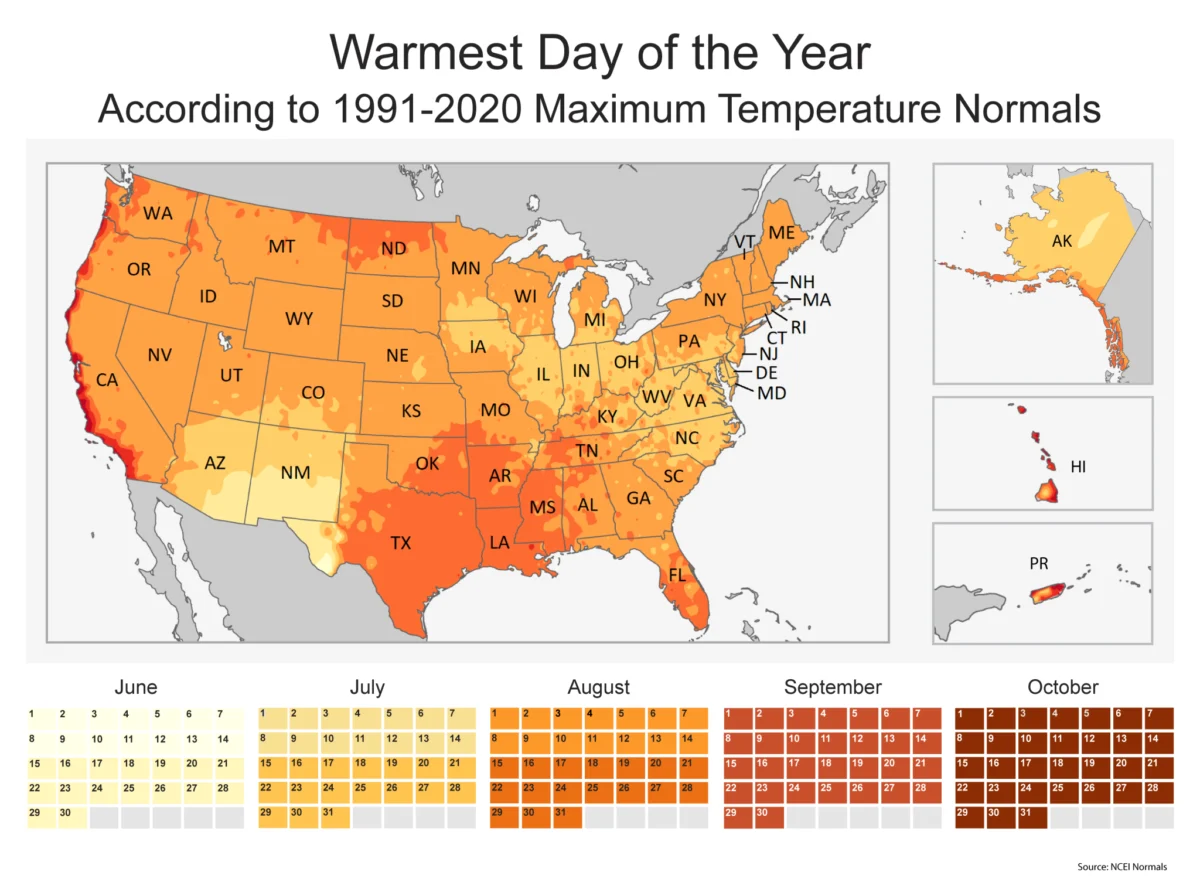
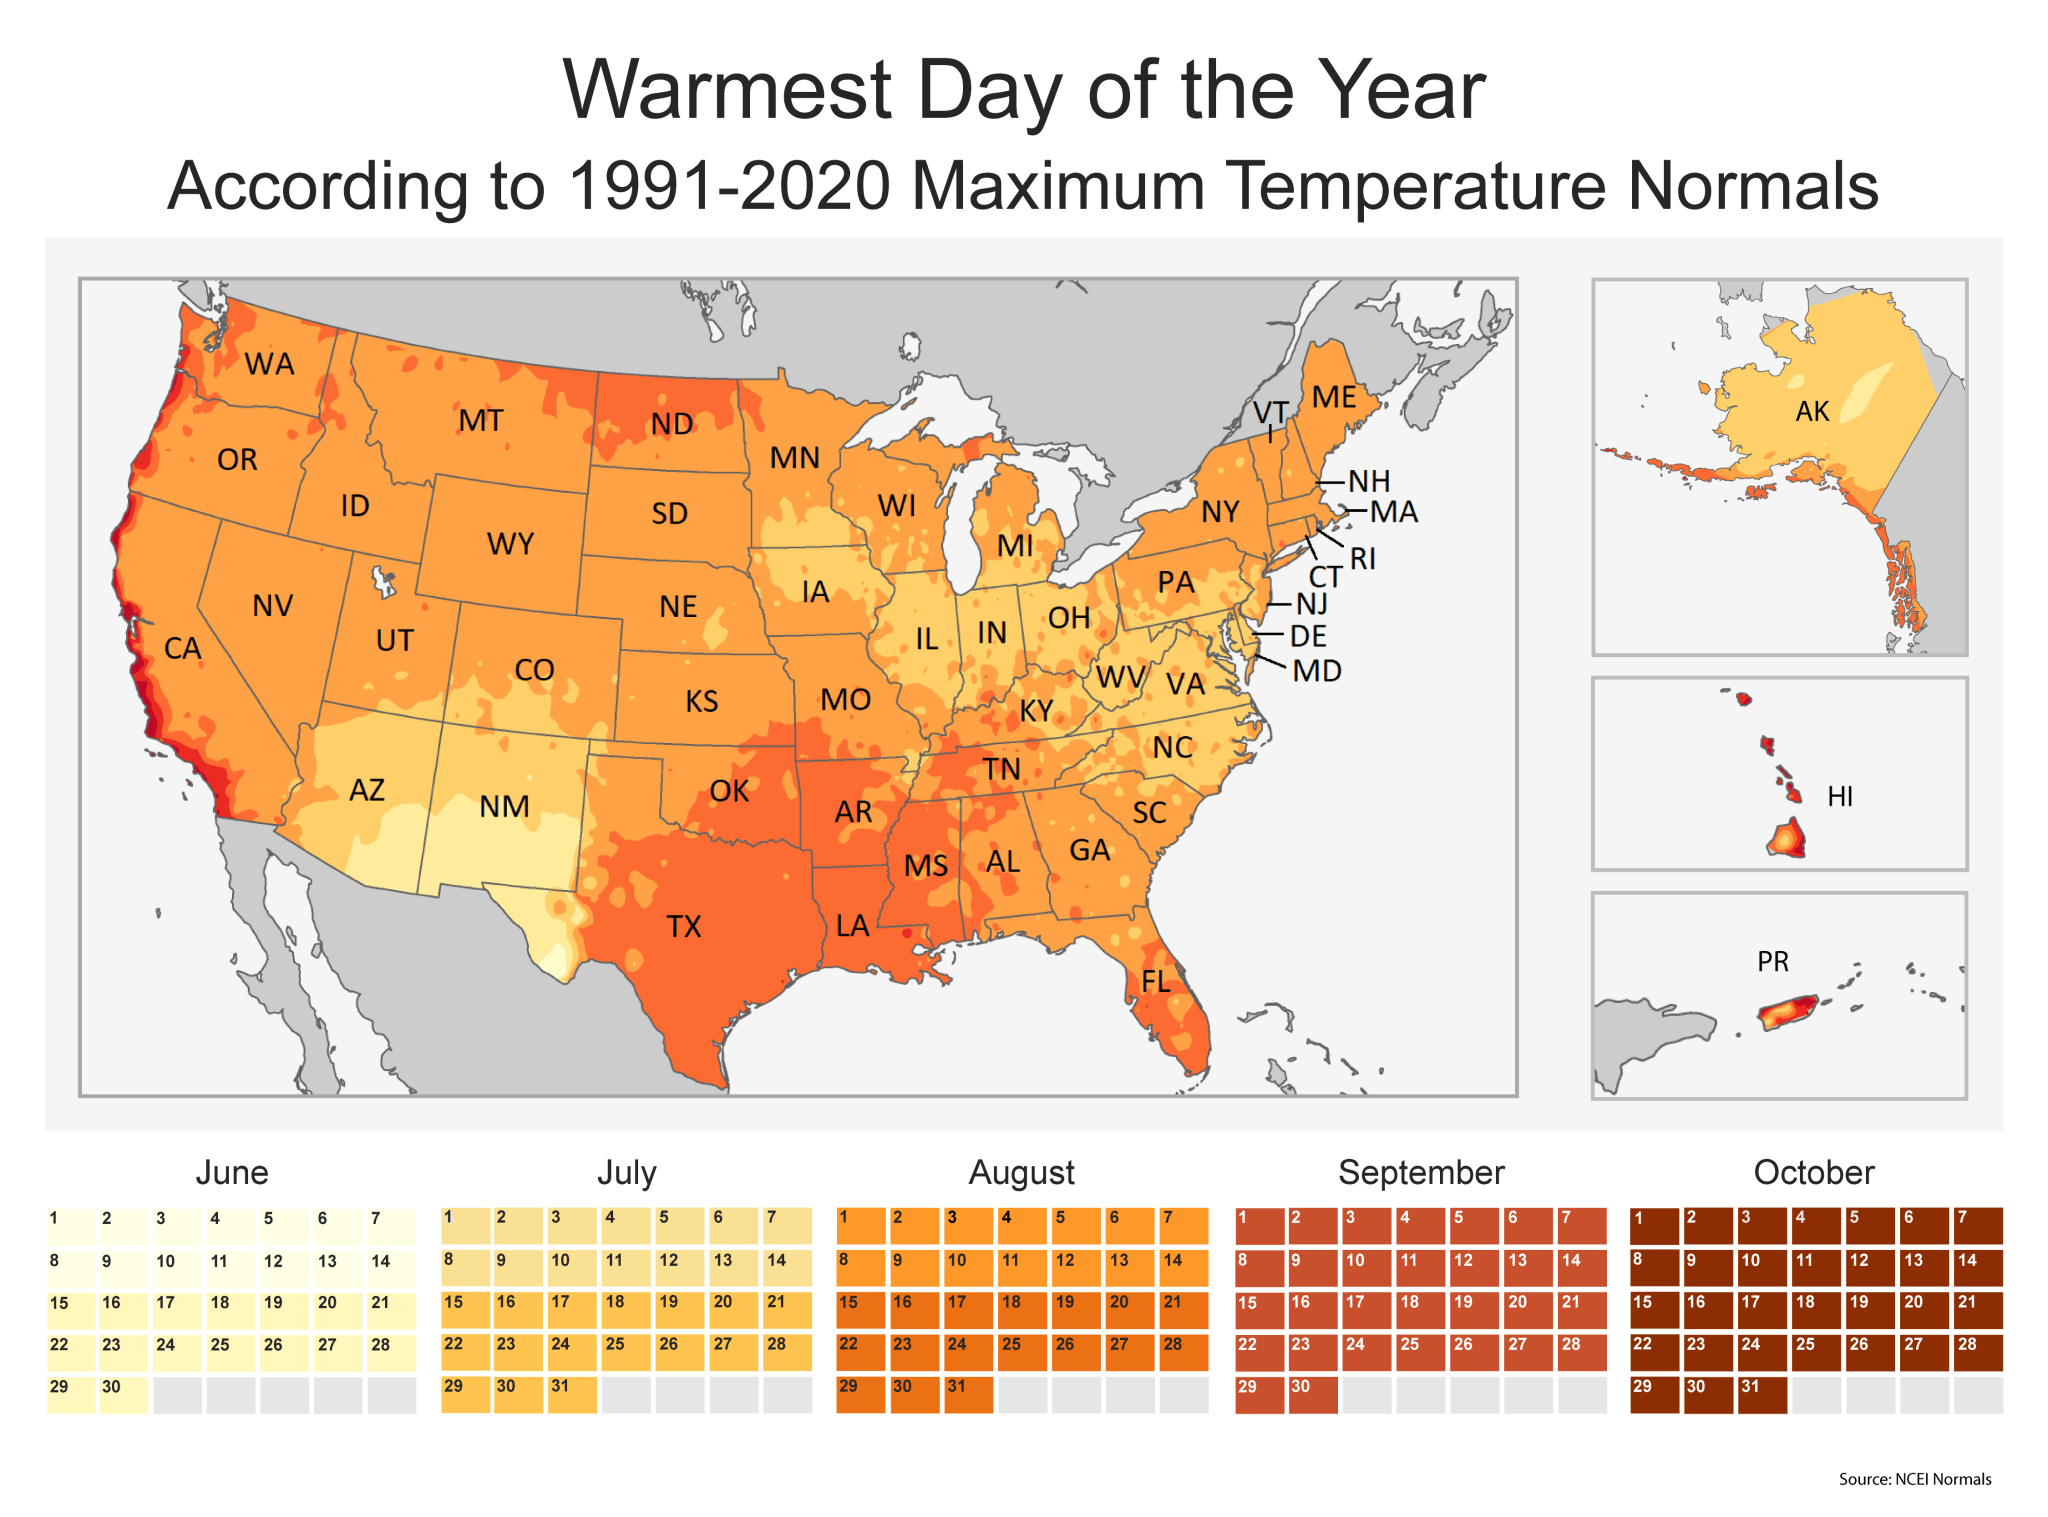
The NOAA National Centers for Environmental Information (NCEI) utilizes "Climate Normals"—30-year averages of climatological variables—to predict these peaks. The most recent data, covering the period from 1991 to 2020, illustrates a clear West-to-East and South-to-North progression, though with several notable anomalies.
The Southwest and the Early Peak
In parts of the Desert Southwest, including Arizona and New Mexico, the hottest days often arrive earlier than in the rest of the country, frequently occurring in late June or early July. This is largely due to the North American Monsoon. As July progresses, moisture-laden air flows into the region from the Gulf of California and the Gulf of Mexico, leading to increased cloud cover and precipitation. This shift often provides a slight cooling effect, meaning the "dry heat" of June and early July often represents the annual temperature ceiling for these states.
The Heartland and the East Coast
For a vast swath of the United States, stretching from the Rocky Mountains through the Midwest and into the Mid-Atlantic and Northeast, the peak typically arrives in mid-to-late July. In these regions, the land heats up relatively quickly compared to the coasts. States like Kansas, Illinois, and Pennsylvania usually see their highest mercury readings during the last two weeks of July, as massive high-pressure systems, often referred to as "heat domes," settle over the central plains and trap warm air.
The Deep South and the Gulf Coast
In the Southeast and along the Gulf Coast—encompassing Texas, Louisiana, Mississippi, and Alabama—the peak is often delayed until August. The proximity to the Gulf of Mexico plays a dual role: the high humidity prevents temperatures from spiking as sharply as they do in the desert, but the massive heat capacity of the Gulf waters means the region continues to warm well into the late summer. For many residents in these states, the most oppressive humidity and heat combinations do not arrive until the "dog days" of mid-to-late August.
The Pacific Coast and the "September Summer"
Perhaps the most dramatic departure from the national norm occurs along the Pacific Coast. In cities like San Francisco, Los Angeles, and even parts of southern Alaska, the hottest days of the year frequently occur in September or even early October. This is caused by the "marine layer"—a thick blanket of cool, moist air moderated by the Pacific Ocean. Throughout June and July, this marine layer keeps coastal temperatures mild. However, as autumn approaches and pressure systems shift, offshore winds (such as the Santa Ana winds in California) can push the cool air out to sea, allowing inland heat to surge toward the coast.
The Role of Climate Change in Shifting Normals
While historical data provides a reliable roadmap, the accelerating pace of climate change is complicating these traditional timelines. According to NOAA and NASA, the last decade has seen the hottest years on record globally. This trend is not just increasing the absolute temperature of the "hottest day" but is also expanding the window of extreme heat.
Climate scientists note that "extreme heat events" are starting earlier and lasting longer. The traditional 30-year normals are being pushed upward with every new decadal update. For instance, the transition from the 1981-2010 normals to the 1991-2020 normals showed a significant warming trend across nearly the entire United States. This shifting baseline means that a "normal" hot day today would have been considered an extreme outlier fifty years ago.
Furthermore, the increased frequency of "stuck" jet stream patterns is leading to more persistent heat domes. These systems can override seasonal lag, creating record-breaking heat in June that surpasses the historical July peak, as seen during the 2021 Pacific Northwest heatwave.
Public Health and Infrastructure Implications
The determination of the hottest day of the year is more than an atmospheric curiosity; it is a critical metric for public health officials and infrastructure managers. Heat remains the leading cause of weather-related fatalities in the United States, surpassing hurricanes, tornadoes, and floods combined.
- Energy Demand: Utility companies use peak heat data to forecast "peak load" events. As temperatures soar, the demand for air conditioning places immense strain on the electrical grid. In states like Texas, the ERCOT (Electric Reliability Council of Texas) grid faces its most significant tests in August, when high temperatures coincide with lower wind speeds, reducing renewable energy output.
- Agriculture: For farmers, the timing of the heat peak relative to the crop cycle is vital. Extreme heat during the pollination phase of corn, which typically occurs in July in the Midwest, can devastatingly reduce yields.
- Urban Heat Islands: Municipalities are increasingly using NOAA data to combat the "Urban Heat Island" effect. In densely populated cities, asphalt and concrete absorb heat during the day and radiate it at night, preventing the cooling that occurs in rural areas. Knowing when the seasonal peak will occur allows cities to activate "cooling centers" and implement "code red" alerts for vulnerable populations, including the elderly and those experiencing homelessness.
Expert Reactions and Meteorological Analysis
Meteorologists emphasize that while the NOAA map provides a high-probability window for peak heat, individual weather events can always defy the average. "The Climate Normals are a tool for expectation, not a guarantee of a specific date," says Dr. Sarah Kapnick, NOAA Chief Scientist, in various climate briefings. "What we are seeing now is a compression of the seasons where the transition from spring to extreme summer heat is happening more abruptly."
The Old Farmer’s Almanac, which has provided long-range weather predictions since 1792, also acknowledges these shifts. While the Almanac traditionally relied on solar cycles and climatology, its modern iterations increasingly incorporate satellite data and advanced fluid dynamics to account for the heightened volatility of the 21st-century atmosphere.
Conclusion: Preparing for an Intensifying Summer
As the data suggests, for much of the United States, the worst of the summer heat is either currently unfolding or yet to arrive. For those in the South and on the West Coast, the peak may still be weeks or months away.
The primary takeaway from the thirty-year meteorological record is the importance of preparation. As heatwaves become more frequent, intense, and long-lasting, the reliance on historical peaks must be tempered with real-time monitoring. Staying hydrated, limiting outdoor activity during peak solar hours (10:00 AM to 4:00 PM), and checking on vulnerable neighbors remain the most effective strategies for navigating the season’s most sweltering conditions.
While the Earth’s thermal inertia ensures a delay between the solstice and the summer peak, the overarching trend of global warming is ensuring that those peaks are reaching new, dangerous heights. Whether the hottest day falls in July or September, the trend is clear: the American summer is becoming a longer, hotter, and more formidable season.

